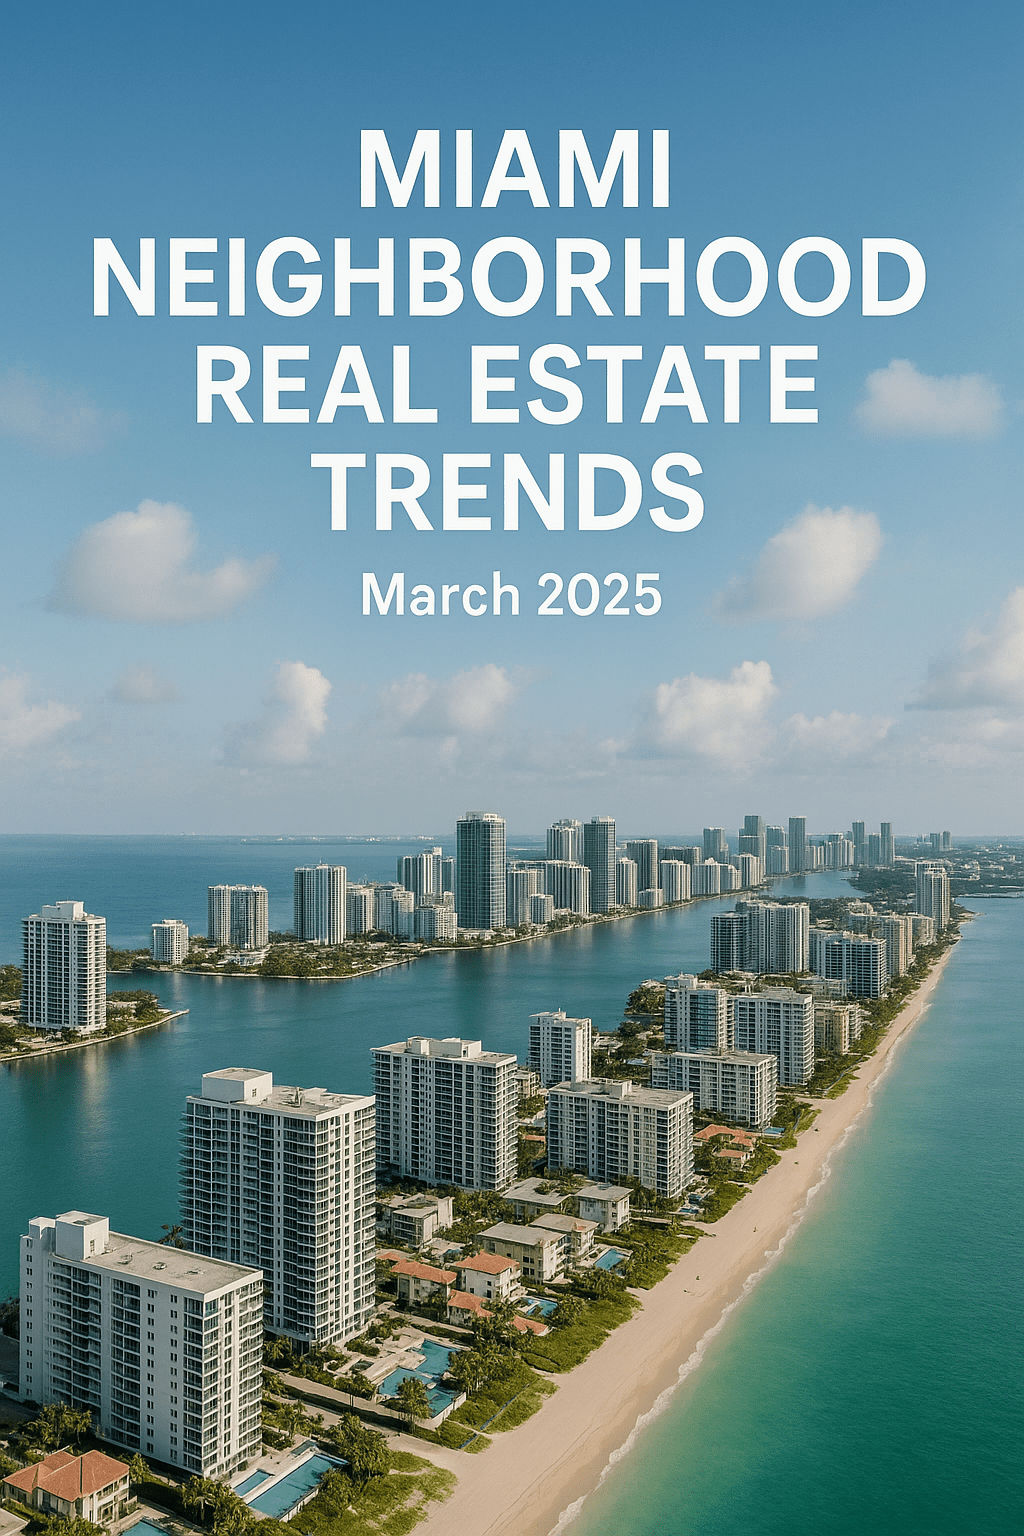
Miami’s real estate landscape in March 2025 saw notable sales declines in key areas while inventory levels continue to climb across the tri-county region. Miami Beach and surrounding barrier islands have been particularly affected, witnessing substantial drops in transaction volume despite modest price appreciation. This evolving market landscape presents both challenges and opportunities for buyers, sellers, and investors. Let’s dive into the specifics of key neighborhoods, using data from multiple sources, including the Real Deal and Rocket Homes.
Miami Beach and Barrier Islands Face Market Headwinds
Miami Beach and its surrounding barrier islands—including Bal Harbour, Bay Harbor Islands, Fisher Island, Golden Beach, Indian Creek, Key Biscayne, North Bay Village, Sunny Isles Beach, and Surfside—are experiencing a significant market correction. Residential sales in these premium coastal areas plummeted by 18 percent year-over-year, with only 650 closings recorded during the first quarter of 2025. This substantial decline highlights growing hesitation among buyers.
The single-family home segment has been hit particularly hard, with transactions dropping by 23 percent to just 74 closings in the first quarter. Simultaneously, condo sales declined by 17 percent, with 576 units changing hands. This suggests a broader pullback across all residential property types.
Perhaps most telling is the dramatic surge in available inventory. Single-family home listings in Miami Beach and the barrier islands skyrocketed by 79 percent to 704 properties on the market1. Condo inventory similarly expanded, jumping 29 percent to reach 4,239 available units. This rapid inventory growth potentially signals the end of the recent seller’s market.
Interestingly, despite declining transaction volume, property values continue to appreciate. The median price for single-family homes in these areas rose by 25 percent to reach $3.7 million, while condo prices increased by nearly 6 percent to $652,500. While fewer properties are changing hands, those at the higher end of the market continue to command premium prices.
Cash buyers account for 73 percent of all closings. This high percentage of cash deals helps explain why prices remain robust despite declining sales volume—cash buyers typically face fewer obstacles to closing and often negotiate from positions of financial strength.
Coral Gables: Mixed Signals
Single-family home sales in Coral Gables fell by 11 percent year-over-year to 71 closings. However, the median sale price surged by an impressive 46 percent to reach $2.6 million. The 5-bedroom segment saw a significant 36.7% price increase. This suggests that the properties that sold were predominantly high-end homes, skewing the median upward.
The Coral Gables condo market tells a completely different story. Condo sales exploded by 75 percent to 56 closings, yet the median price fell by 5 percent to $590,000. This indicates increased activity in the market’s lower price tiers.
Coral Gables experienced a 25.8% increase in median overall home prices to $1,325,600, with inventory rising 9.1% to 503 homes. Inventory in Coral Gables has grown consistently across both market segments, with single-family home listings up 22 percent and condo listings increasing by 26 percent. This inventory expansion will likely temper short term future price growth.
Coconut Grove: Inventory Surges, Prices Hold
The Grove’s median home price hit $1.56M, up 3.4% from 2024. But here’s the twist: inventory ballooned 12.4% month-over-month to 418 listings, flipping this area to a buyer’s market for the first time in years. Want a deal? Focus on 2-bedroom units—prices dipped 6.7% YoY to $1.1M.
Brickell: Condo Market Sees Growth and Inventory
Brickell’s median condo price rose 8.2% to $728,333, with inventory increasing by 12.3% to 1,216 units. 92% of March sales closed below asking price. If you’re eyeing a 2-bed here, expect to pay $775K (+2% YoY) but negotiate hard, because these units are taking 76 days to sell on average. The action happened in Ultra-luxury 5+ bedroom units which saw a 49.6% price increase to $5.2 million.
Pinecrest: Suburban Luxury Holds Steady
Pinecrest’s median hit $2.34M (+9.1% YoY), but Redfin data tells another story with 93% of March sales under asking and homes lingering 58 days on market. There was a significant difference in amongst property types, for example older 3-bed homes ($270K, +5.6% YoY) vs. new 5+ bed estates ($5.1M, +30.1%).
The Roads: A Quiet Correction
The Roads saw median prices drop 27.5% YoY to $730K, however this comes from limited transactions.
Market Implications
-
- Buyers: Deals exist in Coconut Grove and Brickell, where inventory is rising. Negotiate everywhere.
-
- Sellers: Miami Beach and Coral Gables are still good for sellers, but price realistically.
-
- Investors: Edgewater’s development boom presents opportunities but inventories are rising rapidly.
Miami’s real estate market is recalibrating, with divergent trends across South Florida and significant variations between municipalities and property types. These disparities highlight the importance of hyper-local market analysis for buyers, sellers, and investors.
